Putting Crashes Into Perspective
March 21, 2020
We’ve all been impacted by the Coronavirus/COVID-19 at this point. Some just indirectly, because of work-at-home policies and inconveniences of, say, spring break and most all TDYs and PCSs put on hold, March Madness being cancelled, and baseball’s opening day being pushed back by at least a couple of months.
Most of us have also all been impacted by the Coronavirus Crash. The only ones who haven’t been impacted by the crash are those who are only invested in the G Fund, and to a significant extent those who are invested in the F Fund. Taking a look at daily price movements, we can see that every other fund, including all of the L Funds, have experienced major declines in the past few weeks.
To help put things into perspective, I scripted out returns over each 35-year period that began with each new decade, from the first decade of 1900 to 1984 (1984 ends in December 2018). I chose 35 years, because that reflects a career with investing included. Many TSP participants could have their accounts for 40 or even 50 years.
The below returns are based on a starting salary of $30,000, with an investor contributing 5% of salary and getting a government match. The salary (and contributions) increase by 5% each year, for 35 years. Investments are made/calculated monthly in the given funds. These returns are just one example of a variety of returns I examine in detail in TSP Investing Strategies: Building Wealth While Working For Uncle Sam, 2nd Edition
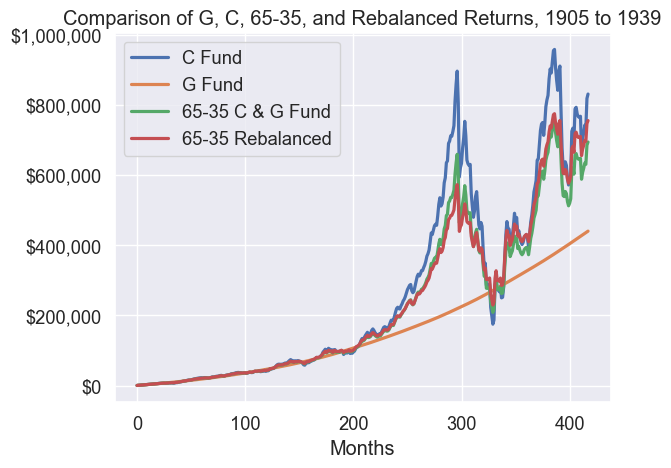
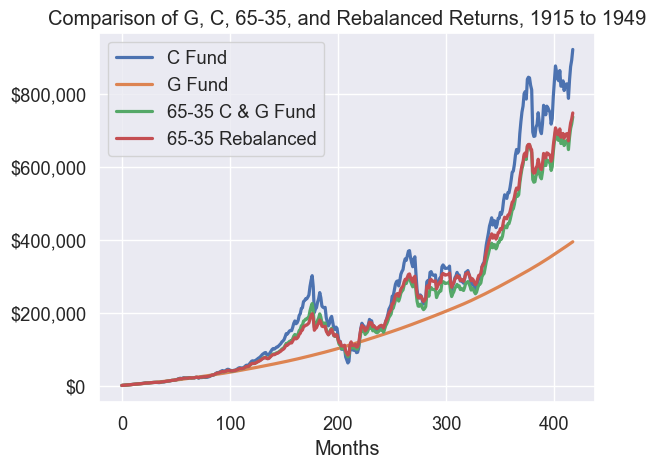
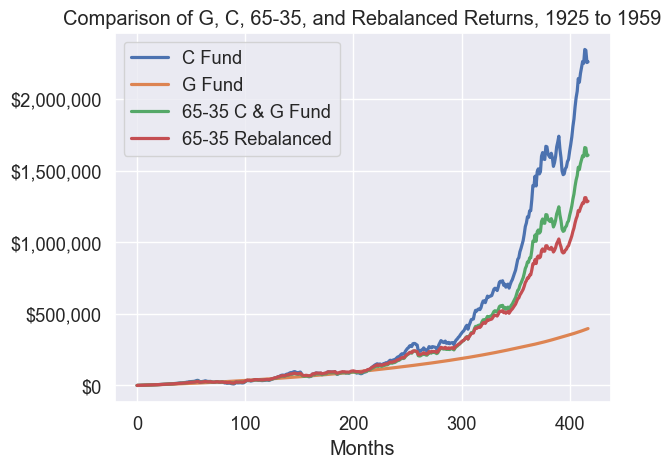
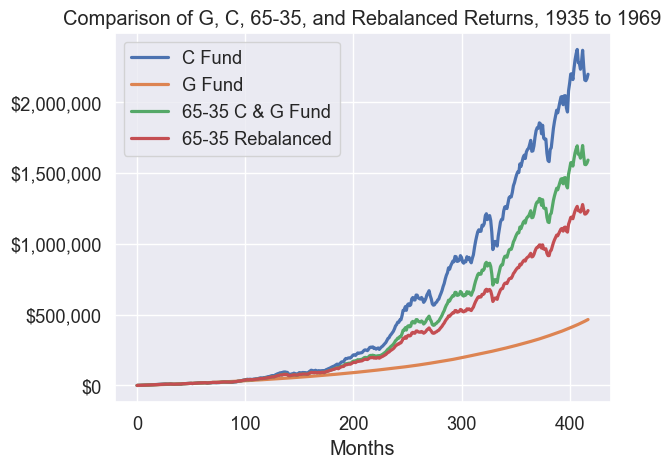
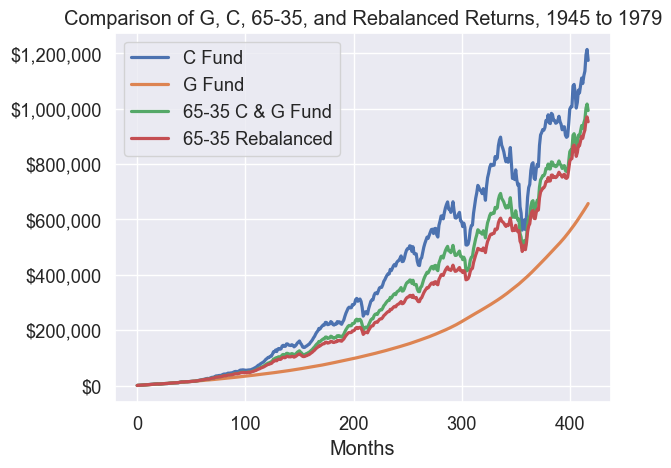
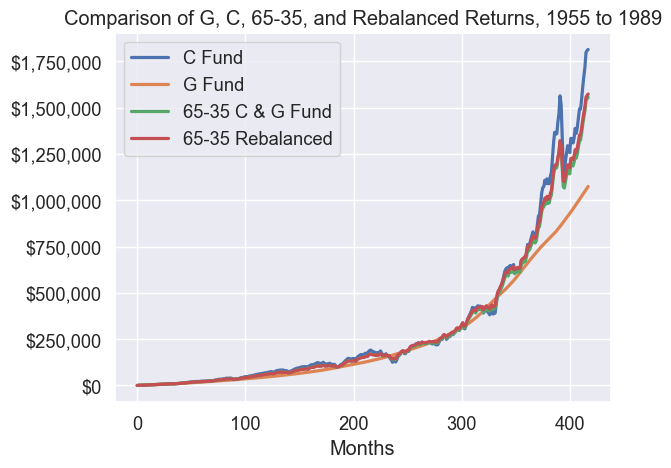
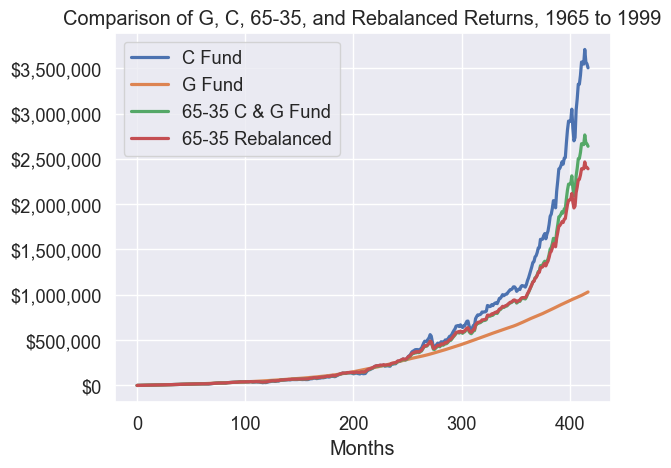
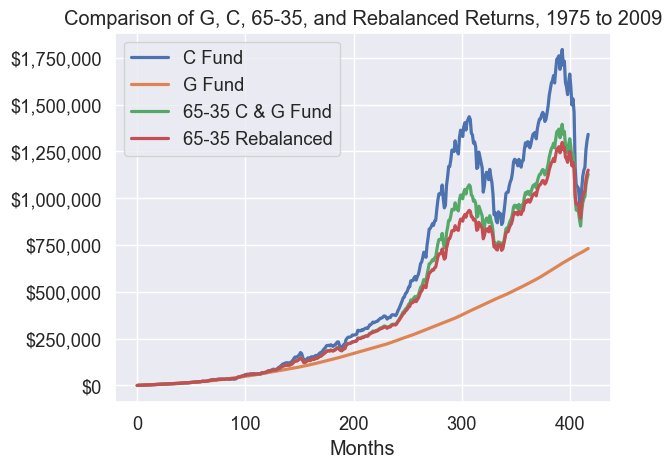
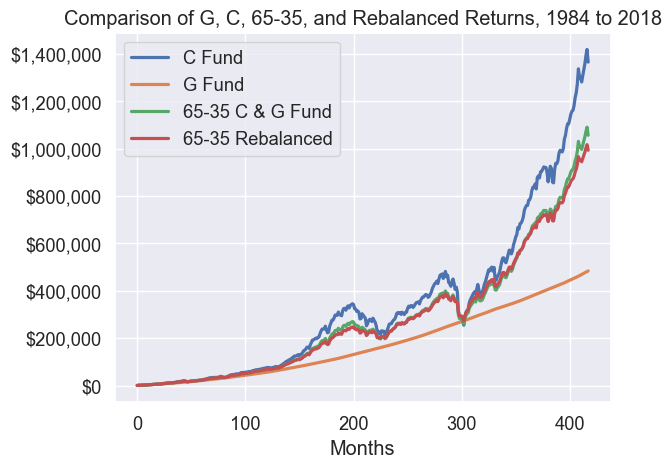
Here are the hypothetical returns for four portfolios. An all-C Fund (U.S. stock) portfolio, an all-G Fund (government bond) portfolio, a 65-35 C Fund-G Fund portfolio (two-thirds in stocks and one-thirds in bonds), unrebalanced, and a 65-35 portfolio that is rebalanced at the end of each year.
As I think you can see, investors in each of the 35-year periods experienced multiple declines in value in every type of portfolio except for one: the all-G Fund portfolio never decreased. But, as you’ll also see, at no point did that all-G Fund portfolio outperform the other portfolios, despite the volatility all the other funds experienced.
The charts below show returns every decade, from 1905-1939 to 1984-2018. The underlying methodologies and datasets are posted on the project’s GitHub page, and additional charts for the below study are here.
Stay safe, and stay healthy.