TSP Investing And The Coronavirus
March 1, 2020
There is an apocryphal Chinese curse that declares: “May you live in interesting times…”
The year 2020 is certainly shaping up to be an “interesting” year, due to the coronavirus/COVID-19. The markets are falling precipitously. In fact, this is the fastest decline of over 10% in equities markets in modern history.
For the month of February, the TSP stock funds dropped around 8% each, with the C Fund dropping 8.2%.
I’ve heard from you all, too: “My TSP is down 14%,” said one colleague. “I’ve lost over $35k,” wrote another reader.
Markets - and TSP stock funds - could very well continue to drop precipitously in the coming couple of months, too. Cases are just now being diagnosed in the United States, which could very well send markets down further. Perhaps the Fed will cut rates, stemming some of the decline, but perhaps not for long.
Or, we could discover a vaccine, or an effective treatment at least, and suddenly the world is safe again. Markets could take off again. We just don’t know.
We can take a look at past events to see how markets performed during such instances. Past events are never completely analogous to current events, but they can serve as a guide.
The influenza pandemic of 1918 is not analogous in this case, even though many reference it because of the global nature of the pandemic. But for our purposes, in terms of market performance in reaction to the pandemic, this is not the best timeframe to examine. If anything, market activity had been subdued because of World War I, which by then had been raging for four years.
The 1957 H2N2 influenza pandemic might be a better timeframe to examine. The pandemic began in Asia from an avian influenza A virus early that year, and by the summer coastal cities in the United States started reporting occurrences as well.
In the second half of 1957, the S&P composite fell five months in a row, starting with more than a 5% decline in August and over 4% in September. The second half of the year saw the S&P drop 20%, from a high of over 49 to a low of 39.42 (the S&P closed at a “low” of 2,954.22 on February 28).
And it didn’t stop there - in 1962, there was another precipitous drop in the markets of about 20% due to…well, I’m not even sure what (kidding: the Cuban missile crisis caused quite the panic that year…). That’s the point, right? Markets will panic from time to time.
So that’s the first take-away from examining this timeframe. Yes, the markets dropped 20%. Not once, but twice in five years. If you have $400,000 invested in a stock fund, that necessarily means it will decline by $80,000, to $320,000. If it dropped by 30%, that’s a decline of $120,000! Six figures. Wow.
In the long-term, so what? When we take a look at a longer-term chart, it’s barely a blip. Imagine if an investor in 1957, facing five months of declines, had panicked and sold everything, and not invested at all (or just invested after the markets “recovered”). How many millions would that investor have lost out on by selling due to an influenza outbreak?
In fact, we can see exactly what an investor would have made by staying invested in and buying more of the S&P 500 - the equivalent of the C Fund - compared to only investing in the “safe” G Fund or government bonds.
Taking an approach to this specific era, as I do extensively in TSP Investing Strategies, 2nd edition, I will chart out the differences when investing in the “C Fund” - S&P 500 - and the “G Fund” - the 10-year U.S. Government Bond (which is very close to the G Fund), from 1949 to 1968. The influenza pandemic takes place about in the middle of this 20-year period, with another couple of declines later too.
Starting with investing a mere $250 at the end of each month in your first year of service, and increasing those amounts by 5% per year over 20 years, you would have invested just over $99,000 during that time. Let’s say half that amount consisted of the government match of 5%, so you really only contributed about $44,500 during those 20 years. Here are the hypothetical results:
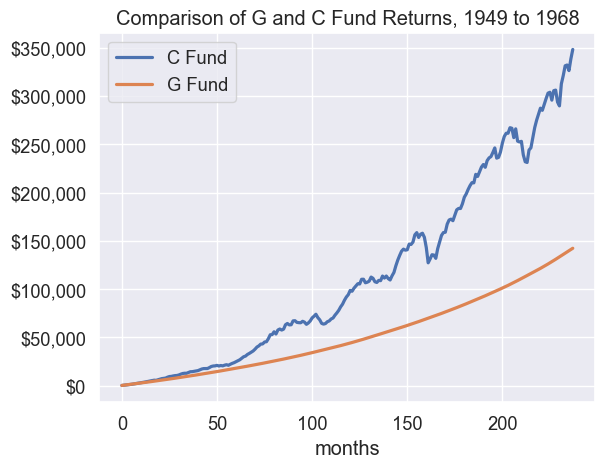
Hypothetical results of investing $99,000 in total in each fund from 1949 to 1968.
Despite the multiple downturns that you can see in the C Fund, you still made out well. The influenza pandemic struck around month 105 in this chart. The 20% decline around 1962 seemed to cause more fluctuation in your C Fund starting at month 160 or so, as you can see. And there was another decline around month 210 or so. But by regularly investing throughout all these fluctuations, and never selling, you still increased your TSP holdings to $350,000 in those 20 years in the C Fund, compared to $150,000 in the “safe” G Fund.
Here’s the big, big takeaway: if you don’t sell, you have not “lost” anything! By that I mean, the values of share prices for each fund vary over time. They often increase, but sometimes they decrease. It’s only the act of selling during a decline in value of the shares that you “lose” money.
It’s like owning a house. The value will fluctuate over time. It generally increases, but sometimes the value drops too. If the value of your house that you live in were to drop suddenly by 10% or 20%, would you suddenly decide you need to sell it and move to an apartment until the housing market stabilized? No! That would be sheer madness. If you didn’t need to move, and all else was equal (the neighborhood was still ok, no sinkholes in the backyard, that sort of thing), then why the heck would you sell? You would continue to pay down your mortgage - eventually paying it off, so you can live rent-free - and live in your humble abode despite the crazy housing market at the time.
Investing in the TSP is the same thing. You certainly don’t want to sell when the market is down! At least, I as a buy-and-hold investor do not. I want to continue to invest in declining markets, so that when the craziness dies down and markets start going up again, I can enjoy the smart investments made during those times of craziness.
Just remember that past performance is not necessarily how markets will perform in the future. I have literally hundreds of these charts, and they all tell a slightly different story. Markets, and our stock-index funds, will probably fall more in the coming weeks. But over the longer-term, over a century of data shows that markets do indeed recover. I examine this and many, many more topics in TSP Investing Strategies, 2nd edition. Other topics include: ensuring you (and your spouse/loved one) have a will in place and adequate life insurance, determining whether you want a living trust, health proxy and limited power of attorney, and making sure you have a plan in place for trusted family or close friends to know how you want your assets and other valuables managed should you become incapacitated. All things to take a look at now, when we can take action.
Now is a time for prudence, not panic. Follow CDC guidance. Get your house in order, literally and figuratively, if you haven’t already.
For buy-and-hold investors, remember your investing strategy and your investing horizon. If it is more than a few years, forget about the financial headlines. Don’t look at your TSP. Things will recover eventually, and as long as you dollar-cost-average into the declining market, you’ll do well. In my research, I’ve found it takes about one to three years to recover following major declines (again, as long as you are buying into the declines), but I’ll get to that later.
For now, stay safe, and thank you all for your service!
Related topics: i-fund c-fund s-fund long-term-investing tsp-updates