Dividend Yields and the TSP Funds
May 23, 2012
The total number of companies in the S&P 500 index – which is the C Fund’s underlying index – paying cash dividends has steadily increased this year. Of the 500 large U.S. companies included in the index, 401 pay out a cash dividend as of mid-May. According to Standard and Poor’s, which decides what companies are included in the S&P 500 index, this is the highest number of dividend-paying companies since 2000. The dividend yield as of May 15 was 2.32%, meaning that for every $10,000 invested in the index, investors receive $232 back, in addition to any increase (or decrease) in the index fund itself. Amazingly, except for the 2008-9 period when the S&P 500 and C Fund plunged to historic lows, this is the highest dividend yield since 1995, although the yield is still low by historical standards (see chart at the bottom of this article).
For C Fund investors, the yield is reduced slightly for administrative expenses, which collectively is called the “expense ratio.” For 2011, the TSP expense ratio ran just over 0.024% averaged among all the funds. For the first few months of 2012, the net expense ratio for the C Fund is an astoundingly low 0.0008%, according to FRTIB stats, although that rose to about 0.04% by 2018:
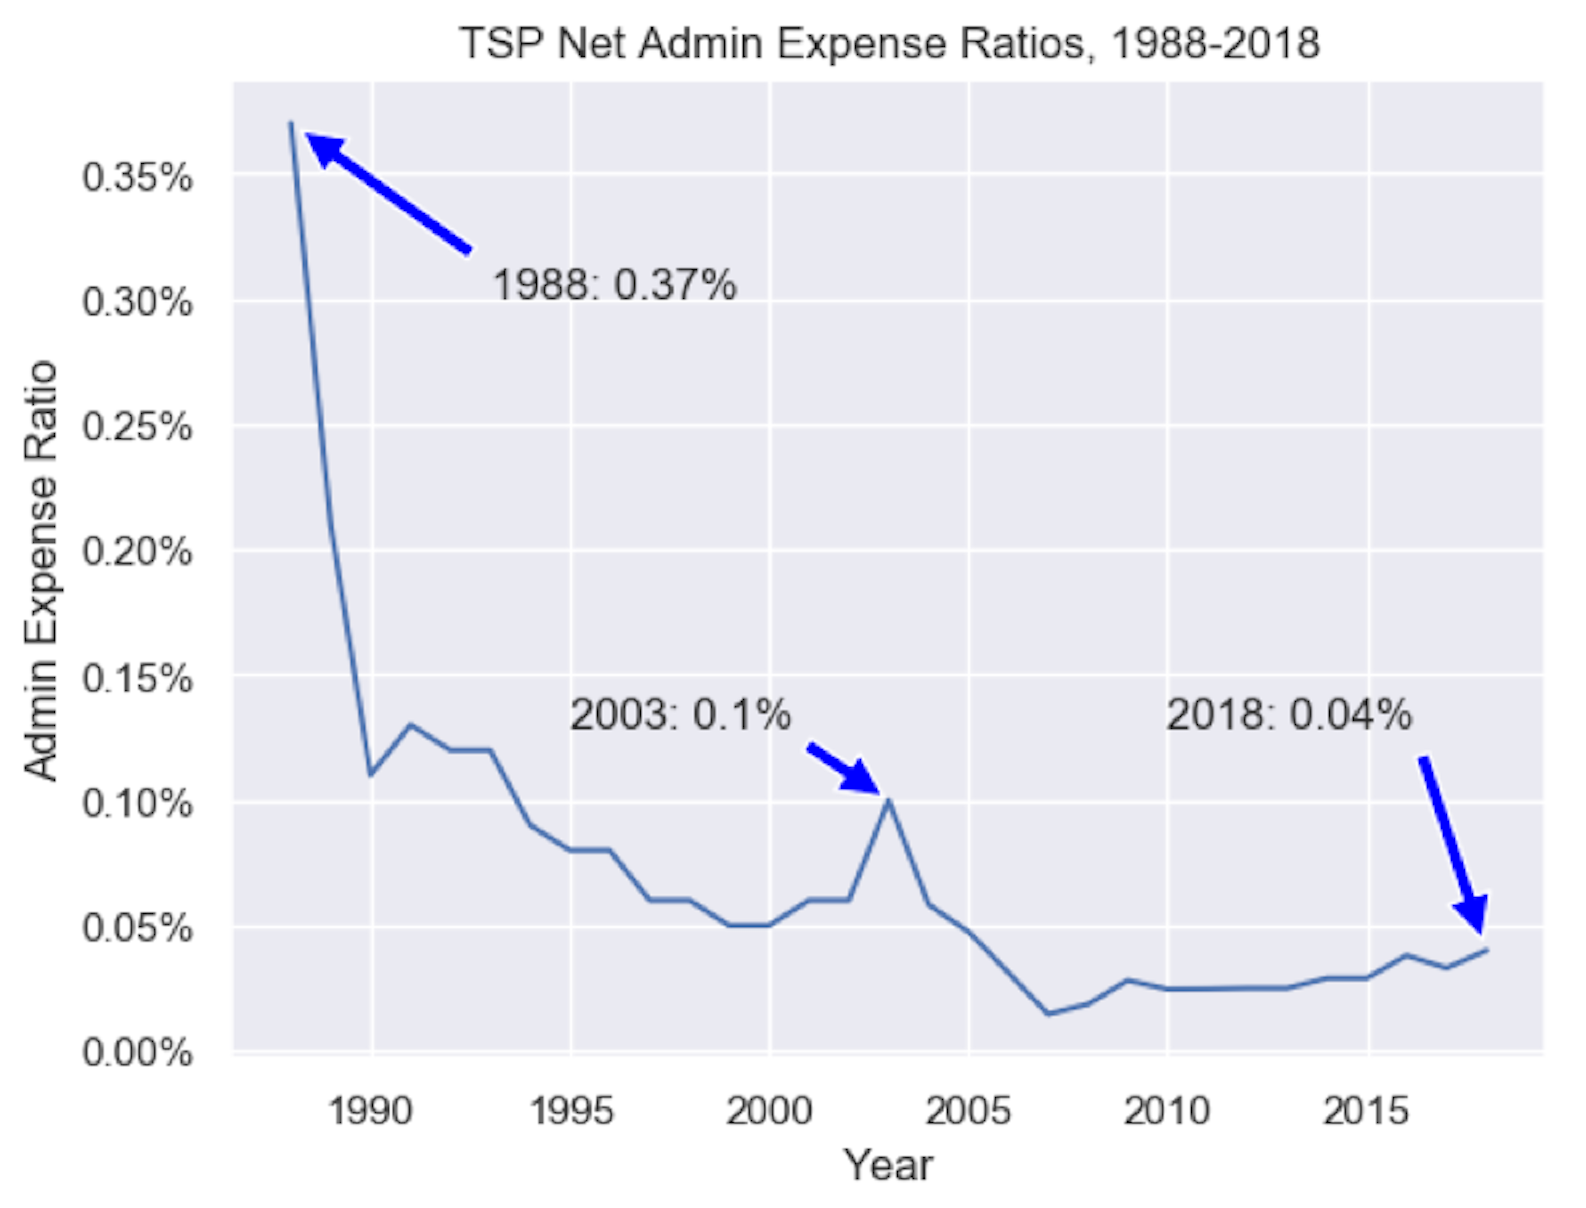
Expense Ratios for the TSP Funds, updated as of 2018
This means that the 2.32% yield is reduced to 2.3192%, or $231.92 per $10,000 invested in the fund – barely anything at all. By comparison, Vanguard, a mutual fund company that features some of the lowest expense ratio funds in the business, reduced its expense ratio on its version of the S&P 500 ETF, the “VOO,” to .05% from .06% (note: the fees dropped again in 2016 to .04%; link is to the updated information…). This .05% expense ratio changes the yield to 2.27%, or $227 per $10,000.
This $5 difference might not sound like much, but over time and as a one’s TSP fund balances grow, the small amounts can make a big difference. And the .05% expense ratio is still extremely low by industry standards – the average expense ratio for stock mutual funds was .84% in 2010. This higher average expense ratio can be a huge difference with higher account balances. With a $1 million account balance, this seemingly small .84% expense ratio is $8,400 in costs per year. The TSP expense ratio for 2011 – 0.0249% – is a mere $249 per year. This is a difference of $8,151 per year on a $1 million portfolio, taken out of your pocket and into the pockets of banks and mutual fund managers.
It is also notable that the yield on the C Fund is now higher than the yield of the G Fund, which has hovered between 1.5% and 1.65% annualized yield in the first few months this year, and has a year-to-date yield of 2.02% through April. The C Fund yield is also about the same as the F Fund, which is just over 2% now. Thus you get a higher dividend pay-out from the C Fund than you do in either of the bond funds, which historically is very rare. By comparison, the small-cap S Fund’s yield is in the low 1% range, while the I Fund is close to 3.5%.
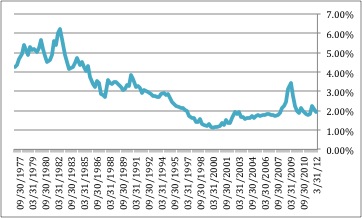
Yield of the S&P 500 Index Since 1977
Moreover, yields generally increase as the total value of the funds decrease, so the “sell in May” effect has served to increase the stock fund yields over the past several weeks, which will increase long-term returns as those cash dividends are automatically re-invested in the stock funds. See the Standard and Poor’s website for more information on the S&P 500 index.
Related topics: c-fund f-fund g-fund s-fund i-fund l-funds